




Fundamental vs Technical Analysis in Modern Trading
The eternal debate in financial markets centers on a single fundamental question: should a trader rely on the underlying economic health of an asset, or should they trust the historical footprints left on a price chart? This dichotomy pits fundamental analysis against technical analysis. Both methodologies serve as foundational pillars for market participants, whether they are trading forex, equities, cryptocurrencies, or commodities. Understanding how these distinct approaches operate, where they intersect, and how to choose the right strategy for your unique psychological profile is critical for long-term survival and profitability in today’s complex trading environment.
As global markets become increasingly driven by algorithmic execution, high-frequency trading (HFT), and rapid macroeconomic shifts, the line between these two methodologies often blurs. Modern retail and institutional traders rarely succeed by operating in a complete vacuum of either strict data crunching or pure chart reading. Instead, the most successful market participants develop a nuanced hybrid approach that leverages the directional bias of fundamentals with the precise execution timing of technicals. This comprehensive guide will dissect both analytical frameworks, explore their internal mechanics, evaluate their respective strengths and weaknesses, and provide a clear roadmap to help you identify which strategy aligns with your personal trading style.
Deconstructing Fundamental Analysis: The Macroeconomic Lens
Fundamental analysis is the art and science of evaluating an asset’s intrinsic value by examining related economic, financial, and qualitative factors. Fundamental analysts study everything from macroeconomic indicators—such as gross domestic product (GDP) growth, inflation rates, employment data, and central bank monetary policies—to microeconomic details like corporate earnings reports, balance sheets, and industry competitive advantages.
The core premise underlying fundamental analysis is market efficiency over the long term. Proponents of this school of thought believe that while market sentiment and temporary noise can cause an asset’s price to deviate significantly from its true value, market forces will eventually correct this mispricing, driving the price back toward its intrinsic value.
Key Components of Fundamental Analysis
To master fundamental evaluation, traders must monitor a wide array of economic data points and structural metrics. These key components form the backbone of macroeconomic research:
A. Central Bank Monetary Policy: Interest rate decisions, quantitative easing (QE) programs, and forward guidance provided by institutions like the Federal Reserve, the European Central Bank, or the Bank of England dictate the cost of capital globally, profoundly influencing currency valuations and asset demand.
B. Inflation Metrics: Consumer Price Index (CPI), Producer Price Index (PPI), and Personal Consumption Expenditures (PCE) data reveal the purchasing power erosion within an economy, forcing central banks to adjust monetary stance accordingly.
C. Employment and Labor Reports: Metrics such as Non-Farm Payrolls (NFP), unemployment rates, and average hourly earnings provide a direct pulse check on consumer health and economic expansion or contraction.
D. Corporate Earnings and Financial Statements: For equity traders, deep dives into balance sheets, income statements, cash flow statements, price-to-earnings (P/E) ratios, and debt-to-equity metrics determine whether a company is financially sound.
E. Geopolitical Developments and Trade Balances: Tariffs, trade agreements, political stability, and international conflicts drastically alter supply chains and commodity pricing, introducing macro risk premiums into asset valuations.
Deconstructing Technical Analysis: The Language of Price Action
In sharp contrast to fundamentals, technical analysis completely ignores the underlying intrinsic value of an asset. Instead, technical analysts study historical market data—primarily price movements and trading volume—using charts and mathematical indicators to forecast future price trajectories.
The philosophy of technical analysis rests upon three foundational axioms established by pioneer Charles Dow:
- Market action discounts everything: All known and unknown macroeconomic, political, and psychological factors are already fully reflected in the current asset price.
- Prices move in trends: Markets do not move randomly; once a trend is established, price movements are more likely to continue in that direction than reverse.
- History repeats itself: Human psychology remains consistent across generations, meaning chart patterns that signaled specific outcomes in the past are likely to produce similar results in the future.
Key Components of Technical Analysis
Technical traders rely on a diverse toolkit to analyze market structure, momentum, and volatility. These methodologies help pinpoint precise entry and exit locations:
A. Support and Resistance Levels: Horizontal price zones where historical selling pressure has paused upward movement (resistance) or buying pressure has halted downward slides (support), representing psychological battlegrounds for market participants.
B. Trendlines and Chart Patterns: Geometric formations such as triangles, head-and-shoulders, double tops, and channels that help traders visualize market sentiment shifts and continuation or reversal setups.
C. Momentum and Trend Indicators: Mathematical calculations derived from price data, including the Relative Strength Index (RSI), Moving Average Convergence Divergence (MACD), and Exponential Moving Averages (EMAs), which quantify market strength and velocity.
D. Volume and Liquidity Analysis: Examining the volume of shares, contracts, or units traded during specific price intervals to confirm the validity of a breakout or trend continuation.
E. Fibonacci Retracements and Extensions: Mathematical ratios derived from the Fibonacci sequence used to anticipate potential retracement depths and profit targets within an established trend.
Comparative Matrix: Fundamental vs. Technical Analysis
To visualize the operational differences between these two strategies, the following matrix breaks down their core characteristics across various trading dimensions:
| Feature | Fundamental Analysis | Technical Analysis |
| Core Focus | Economic health, financial statements, intrinsic value | Price action, volume history, chart patterns |
| Primary Time Horizon | Long-term (Months to Years) | Short-term to Medium-term (Seconds to Weeks) |
| Data Sources | Earnings reports, central bank minutes, economic calendars | Price charts, indicators, order books |
| Main Goal | Identify undervalued or overvalued assets | Identify market timing, momentum, and trend turning points |
| Psychological Challenge | Overcoming cognitive bias, patience during extended drawdowns | Managing emotional discipline, avoiding over-trading and indicator paralysis |
| Ideal User Profile | Value investors, macro hedge fund managers, long-term position traders | Day traders, swing traders, algorithmic execution specialists |
The Hybrid Approach: Merging Macro Bias with Micro Execution
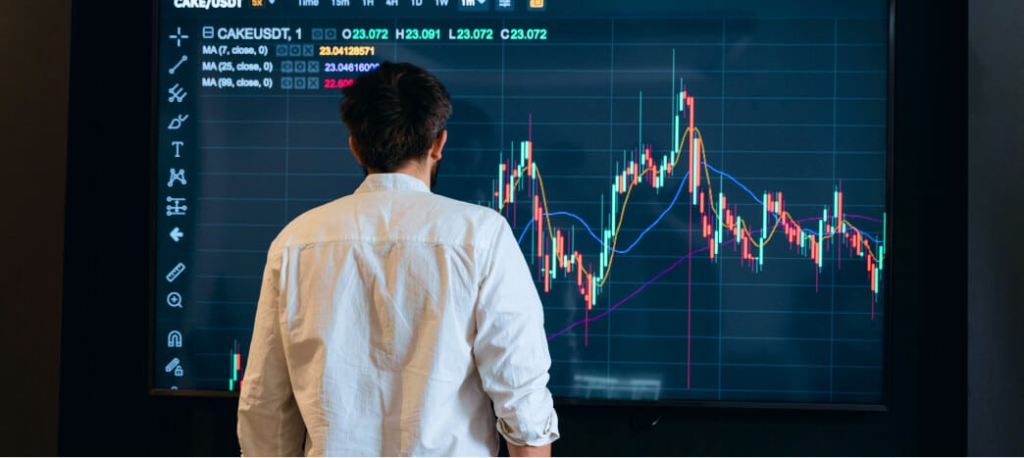
While many trading textbooks present fundamental and technical analysis as mutually exclusive philosophies, contemporary professional trading operations almost universally combine them. This synergy allows traders to answer two critical questions: What should I trade? and When should I trade it?
The Top-Down Trading Framework
A robust hybrid methodology follows a structured top-down analytical pipeline, ensuring that macro conviction is backed by micro precision:
A. Establish Macro Direction via Fundamentals: Begin by analyzing macroeconomic conditions, interest rate differentials, and global sentiment to determine a directional bias. For instance, if inflation is persistently high and a central bank is shifting toward aggressive tightening, your fundamental bias for that currency or risk asset will be bearish.
B. Scan for Technical Setups Aligned with Bias: Once your directional bias is established, turn to technical charts. Search exclusively for setup patterns that conform to your fundamental direction—such as shorting rallies into major resistance levels during a broader macroeconomic downtrend.
C. Execute with Risk Management Parameters: Utilize technical indicators and volatility measures (such as Average True Range) to calculate precise stop-loss placements and profit targets, ensuring a favorable risk-to-reward ratio on every executed trade.
D. Monitor Catalyst Calendars: Maintain constant awareness of upcoming economic data releases or central bank speeches. Technical setups can quickly be invalidated or supercharged by unexpected fundamental data releases, requiring rapid position adjustments.
Psychological Profiles: Which Strategy Fits Your Personality?
Choosing between fundamental and technical analysis is not merely an intellectual exercise; it is deeply tied to your psychological makeup, risk tolerance, available time commitment, and lifestyle goals.
Are You Cut Out for Fundamental Analysis?
Fundamental analysis requires immense emotional resilience, patience, and intellectual curiosity. It is well-suited for traders who possess specific behavioral traits:
A. Long-Term Patience: Fundamental trades often take weeks, months, or even years to fully play out. If you feel compelled to check your profit and loss statements every five minutes, pure fundamental trading will likely induce high anxiety.
B. Comfort with Ambiguity: Economic data is often contradictory or subject to heavy revisions. Fundamental traders must be comfortable making high-conviction decisions in environments where complete certainty is impossible.
C. Strong Analytical Curiosity: You must enjoy reading balance sheets, parsing central bank press releases, tracking global supply chains, and understanding geopolitical friction points.
Are You Cut Out for Technical Analysis?
Technical analysis appeals to individuals who thrive on structure, visual patterns, fast-paced decision-making, and immediate feedback loops. It is well-suited for traders who exhibit these characteristics:
A. High Decisiveness and Discipline: Technical trading requires rapid execution and strict adherence to predetermined risk rules. Hesitation can lead to missed entries or disastrous slippage.
B. Preference for Defined Rules: Technical strategies can be systematically backtested and quantified into explicit rules-based systems, appealing to logically structured, mathematically minded individuals.
C. Active Engagement Preference: If you enjoy sitting in front of screens, monitoring order flow, managing short-term market fluctuations, and closing all positions before the market day ends (day trading), technical analysis is your natural domain.
Common Pitfalls and How to Avoid Them
Regardless of whether you lean toward fundamentals, technicals, or a hybrid framework, every trading style carries distinct psychological and tactical traps that can erode capital.
Pitfalls in Fundamental Trading
A. Ignoring Market Sentiment: Just because an asset is fundamentally undervalued does not mean its price will rise immediately. As the famous market adage notes, “The market can remain irrational longer than you can remain solvent.”
B. Analysis Paralysis: Drowning in too much macroeconomic data can prevent you from pulling the trigger on high-probability opportunities.
C. Confirmation Bias: Falling so deeply in love with an economic thesis that you ignore contradictory price action or deteriorating technical structures.
Pitfalls in Technical Analysis
A. Over-Indication (Indicator Clutter): Plastering a chart with twenty different oscillators and moving averages until the actual price action is completely obscured, leading to conflicting signals and frozen decision-making.
B. Ignoring Macro Risk Events: Relying solely on technical patterns while completely ignoring an impending high-impact economic release (like an unexpected rate hike or employment report) that can instantly smash through key technical support levels.
C. Data Overfitting (Curve Fitting): Designing a technical strategy that performs brilliantly on historical backtests because it was overly optimized to past price data, only to fail miserably in live forward markets.
Crafting Your Personalized Trading Blueprint
There is no singular “holy grail” methodology in financial trading. Fundamental analysis offers a deep, structural understanding of why assets move over long horizons, while technical analysis provides the acute tactical precision required to master when to enter and exit the market.
Your ultimate choice should not be an ideological commitment to one camp over the other. Instead, view these methodologies as complementary tools in your professional toolkit. By accurately assessing your psychological profile, daily time availability, and risk tolerance, you can forge a personalized trading strategy that harnesses the structural clarity of fundamentals with the execution power of technicals. Maintain stringent risk management, continuously test your assumptions, and remember that adaptability remains the ultimate competitive advantage in the dynamic world of modern financial markets.