

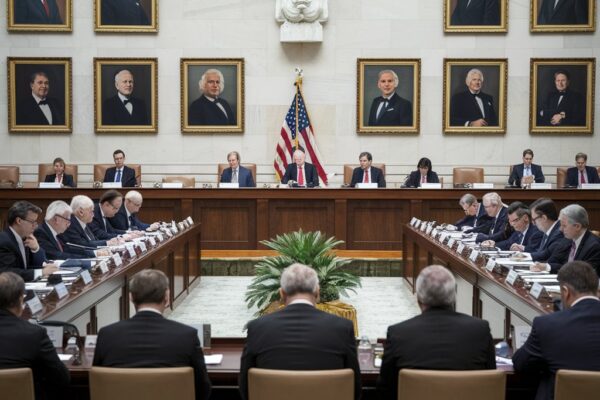


Navigating the global financial markets requires an acute understanding of central bank policies, and among all institutional bodies, the United States Federal Open Market Committee (FOMC) reigns supreme. For both novice traders and long-term investors, the bi-monthly meetings of the Federal Reserve are monumental events that dictate the flow of global capital, influence currency valuations, and set the baseline for risk asset performance. When the FOMC releases its rate decisions, policy statements, and economic projections, the repercussions are felt instantaneously across equities, foreign exchange, commodities, and fixed-income markets.
For beginners, the jargon associated with central banking—terms like “quantitative tightening,” “hawkish pivots,” “basis points,” and “dot plots”—can feel like an impenetrable wall. However, mastering the art of interpreting FOMC outcomes is one of the most valuable skills a market participant can acquire. This comprehensive guide is designed to demystify the Federal Reserve’s decision-making process, break down the core components of an FOMC release, and provide you with actionable strategies to interpret these results accurately to protect your capital and grow your portfolio.
The Anatomy of the Federal Reserve and the FOMC
To understand how to interpret FOMC results, one must first understand what the FOMC is and why its mandate carries such immense weight. The Federal Open Market Committee is the branch of the Federal Reserve System that determines the direction of monetary policy in the United States. Composed of twelve voting members—including the members of the Board of Governors and a rotating group of regional Federal Bank presidents—the FOMC meets eight times a year to evaluate economic conditions.
The primary dual mandate given to the Federal Reserve by the U.S. Congress consists of two core objectives:
- Maximum Employment: Promoting an economic environment where anyone who wants to work can find a sustainable job, minimizing structural and cyclical unemployment.
- Price Stability: Maintaining a low, stable, and predictable inflation rate, historically targeted around 2 percent over the long term.
To achieve these objectives, the FOMC manipulates the levers of monetary policy. When inflation runs too hot, the committee tends to tighten policy. When the economy slows down or enters a recessionary phase, they ease policy. Understanding this fundamental push-and-pull is the foundation of reading any FOMC result.
Decoding the Core Components of an FOMC Release
When FOM meeting day arrives, the release of information does not happen all at once. Instead, it is delivered in a structured sequence, each part offering critical clues about the health of the economy and the future trajectory of interest rates.
1. The Rate Decision and the Statement
At precisely 2:00 PM Eastern Time on the final day of a meeting, the FOMC releases its monetary policy statement. This brief document contains the headline news: whether interest rates were hiked, cut, or left unchanged.
A. The Federal Funds Rate Target: This is the interest rate at which commercial depository institutions lend balances held at the Federal Reserve to other depository institutions overnight. It serves as the benchmark for all other borrowing costs in the economy, including mortgages, credit cards, and corporate loans.
B. Vote Tally: At the bottom of the statement, the vote tally is revealed (e.g., 10-2 or 11-1). Unanimous votes signal strong consensus, whereas dissenting votes indicate internal division among committee members, often hinting at a turning point in monetary policy.
C. Forward Guidance Language: The text of the statement is heavily scrutinized by algorithms and human analysts alike. Minor modifications in adjectives—such as shifting from “some additional policy firming may be appropriate” to “the extent of any additional tightening”—can drastically change market expectations.
2. The Summary of Economic Projections (SEP) and the Dot Plot
Released four times a year (in March, June, September, and December), the SEP provides a deeper look into the Fed’s internal forecasting. It includes projections for Gross Domestic Product (GDP) growth, the unemployment rate, and Personal Consumption Expenditures (PCE) inflation over the next several years.
A. The Dot Plot: This legendary chart plots each FOMC participant’s individual expectation of where the federal funds rate should be at the end of the current year and over the next few years. Markets fixate on the “median dot,” which represents the consensus view of the committee. Shifts in the median dot can instantly trigger massive rallies or sell-offs across global asset classes.
3. The Fed Chair’s Press Conference
Thirty minutes after the statement is published, the Federal Reserve Chair steps up to the podium to hold a live press conference. This event often generates more volatility than the written statement itself.
A. Tone and Demeanor: Traders listen closely not just to what the Chair says, but how they say it. A confident, stern tone addressing persistent inflation signals a hawkish stance, while a more relaxed demeanor acknowledging labor market cooling signals a dovish posture.
B. Q&A Session Dynamics: During the question-and-answer session with journalists, the Chair is forced to improvise. Unscripted remarks can clarify ambiguous points in the statement or unintentionally shock the market, making real-time interpretation a high-stakes endeavor.
Categorizing Central Bank Stances: Hawkish vs. Dovish

To interpret FOMC results efficiently, investors must master financial lexicon describing monetary policy attitudes. These attitudes generally fall into three primary categories:
A. Hawkish Stance: A “hawk” is a policymaker focused primarily on keeping inflation under control, even if it means raising interest rates aggressively and slowing down economic growth. A hawkish FOMC result features higher rates, an upward revision of inflation forecasts, or warnings that policy must remain restrictive for an extended period. This generally strengthens the U.S. dollar and pressures equities and non-yielding assets like gold.
B. Dovish Stance: A “dove” is a policymaker who prioritizes maximum employment and economic expansion, often willing to tolerate slightly higher inflation to keep the job market robust. A dovish FOMC result features interest rate cuts, hints of monetary easing, or an emphasis on downside risks to economic growth. This typically weakens the U.S. dollar, boosts stock market valuations, and drives up commodity prices.
C. Neutral Stance: A neutral stance occurs when the Fed signals a “wait-and-see” approach, holding rates steady while data-dependent metrics guide future moves. Volatility can still occur here if the market was expecting a directional shift and received ambiguity instead.
Step-by-Step Framework for Interpreting FOMC Results
Interpreting FOMC data requires cutting through the noise and focusing on the delta—the difference between what the market expected and what the Fed actually delivered. Use the following structured framework to analyze any FOMC meeting:
Step 1: Pre-Meeting Expectations Assessment
Before the release, check market pricing tools such as the CME FedWatch Tool. Knowing whether a rate hold was priced in at a 90% probability or a 50% probability tells you how much “surprise” is baked into current asset prices. If a hike is 100% priced in, a hike will cause little movement; a pause in that scenario, however, will trigger an explosive market reaction.
Step 2: Analyze the Initial Reaction (The First 15 Minutes)
When the statement drops, look at how major benchmarks react instantly. Does the U.S. 10-year Treasury yield spike or plunge? Does the U.S. Dollar Index (DXY) surge? High-frequency algorithms react to keywords and headline numbers within milliseconds. Do not rush to trade this initial impulse, as it is frequently prone to “whipsaw” reversals once human traders digest the nuances.
Step 3: Deconstruct the Dot Plot and Projections
Check if the longer-term rate path has shifted. Did the committee members raise their terminal rate expectations for future years? If the statement sounds neutral, but the dot plot reveals two fewer rate cuts than previously estimated, the overall outcome is quietly hawkish.
Step 4: Listen for Clarifications During the Press Conference
Identify the key themes emphasized by the Fed Chair. Did they express greater concern over sticky service-sector inflation, or did they highlight weakening labor market data? Aligning your interpretation with the Chair’s primary focal points will give you clarity on the Fed’s immediate reaction function to incoming economic data.
Common Pitfalls and Mistakes Made by Beginners
Even seasoned market participants occasionally misread central bank communications. Beginners are particularly susceptible to specific analytical errors:
A. Focusing Solely on the Headline Rate: Many novice traders check only whether rates went up or down, ignoring the forward guidance, statement revisions, and economic projections. The future path of policy matters infinitely more than the current status quo.
B. Trading the Knee-Jerk Spike: Entering a position immediately at 2:00 PM based on the initial headline price movement is a recipe for heavy losses. Algorithms often engineer fake breakouts to trap emotional retail liquidity before the true trend establishes itself during the press conference.
C. Ignoring Data Dependence: The Fed repeatedly emphasizes that its decisions depend entirely on incoming economic data (CPI prints, Non-Farm Payrolls, Retail Sales). Assuming the Fed has a rigid, unchangeable roadmap for the entire year will lead to misinterpretations when unexpected inflation or employment prints force a policy pivot.
D. Confusing “Less Dovish” with “Hawkish”: If the Fed slows down the pace of rate hikes from 50 basis points to 25 basis points, it does not mean they are becoming dovish; they are simply tightening at a slower speed. Failing to recognize the difference between rate cuts and a reduced pace of tightening causes severe directional errors.
Practical Application Across Different Asset Classes
Different financial markets interpret and react to FOMC results in unique ways. Understanding these cross-market correlations helps investors build resilient portfolios:
1. The Foreign Exchange (Forex) Market
Currency valuations are heavily driven by interest rate differentials between nations. If the FOMC delivers a hawkish surprise, foreign capital floods into U.S. dollars to capture higher yields, causing currency pairs like EURUSD or GBPUSD to drop sharply. Conversely, a dovish pivot undermines the dollar, lifting major global currencies and emerging market assets.
2. Equities and Stock Markets
Traditional stock markets have a complex relationship with the FOMC. While lower interest rates reduce corporate borrowing costs and increase present valuations of future cash flows (benefiting growth and tech stocks), rapid rate cuts executed during an economic crisis can signal a looming recession, triggering panic selling. Conversely, a strong economy with modest rate adjustments provides a stable backdrop for sustainable equity growth.
3. Fixed Income and Bond Markets
Bond prices move inversely to yields. When the FOMC signals higher-for-longer interest rates, short- and intermediate-term Treasury yields rise, and existing bond prices fall. Understanding yield curve dynamics—such as inversions between 2-year and 10-year yields—provides powerful forecasting cues regarding economic health and upcoming recession risks.
4. Commodities and Precious Metals
Hard assets like gold (XAUUSD) and silver have an inverse relationship with real interest rates and the U.S. dollar. When FOMC results drive real yields higher and strengthen the dollar, gold faces heavy headwinds. When the Fed turns dovish, real yields drop and inflation fears mount, making gold an attractive safe-haven store of value.
Developing Long-Term Monetary Literacy
Interpreting FOMC results is not about possessing a crystal ball or predicting the exact number of basis points the Federal Reserve will adjust at a future meeting. Rather, it is a disciplined exercise in risk assessment, expectation management, and understanding macroeconomic feedback loops.
By familiarizing yourself with the core tools of the central bank—ranging from the policy statement and dot plot to the nuances of press conference rhetoric—you transform yourself from a reactive spectator into an informed, analytical market participant. Always weigh the data against prevailing market consensus, maintain strict risk management parameters, and remember that monetary policy operates with long, variable lags. Armed with this knowledge, you can navigate future FOMC cycles with confidence, clarity, and strategic precision.